Visualizing and communicating results with clients is made easier with the use of models. Models can also be utilized for generating stratifications for carbon projects and for developing nutrient sampling strategies.
To create a model in FarmLab, you must either upload soil test results or obtain results from a laboratory. Follow these steps to begin:
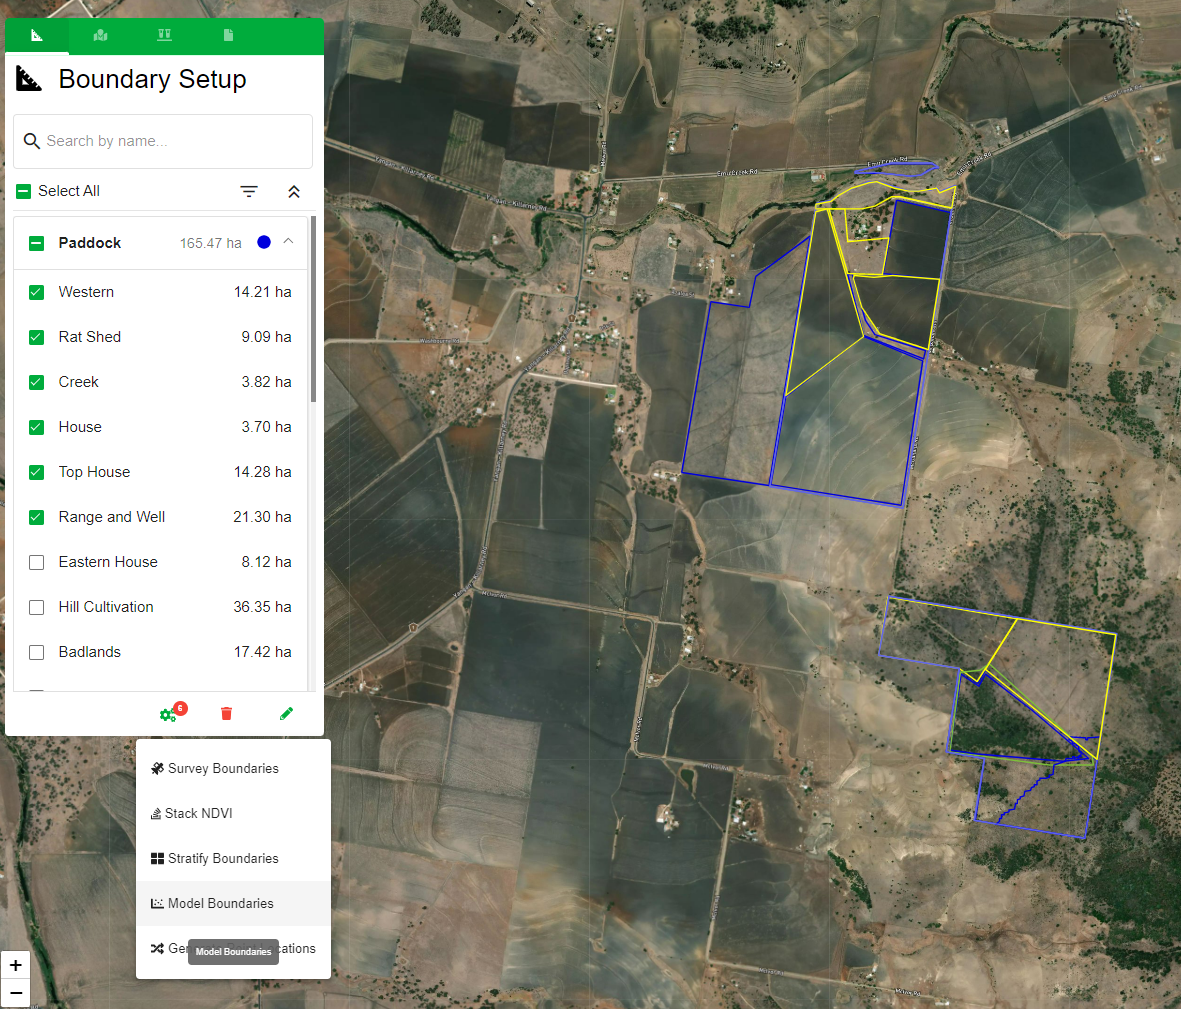
1. In the boundary menu, select the boundaries you want to model.
2. From the processing menu, select "model boundaries."
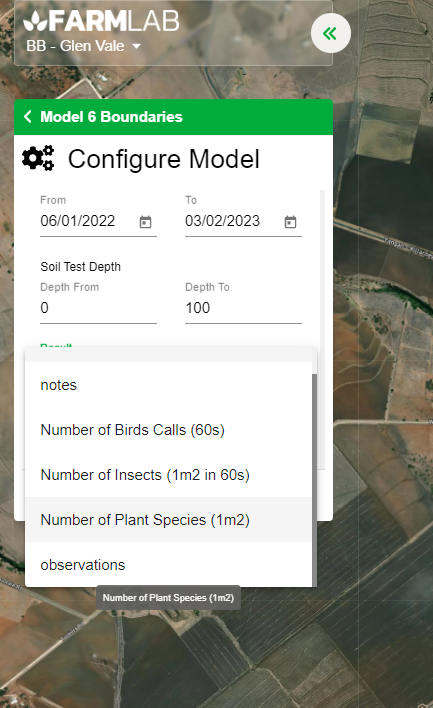
3. Choose the date, depth, and result you want to model. Note: FarmLab does not allow modeling results from different depths. If you have results from different depths (e.g. 0-30cm and 0-20cm) for the selected date range, you must remove one of the points with that depth.
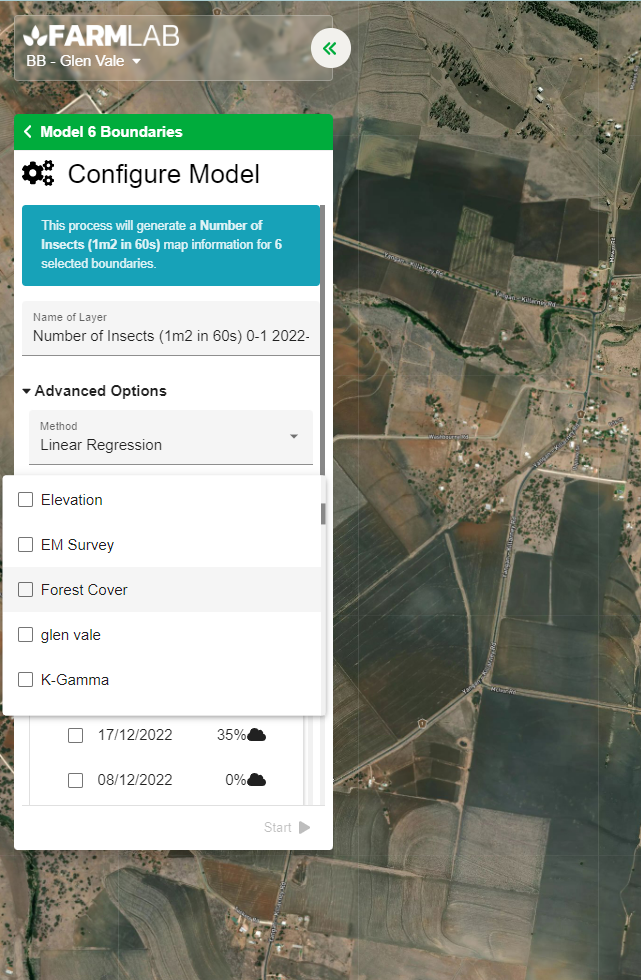
4. Select the modeling technique you prefer. For more information on modeling techniques, refer to https://www.fao.org/documents/card/en/c/I8895EN/. If you are new to this, we suggest using the 'Linear Regression' technique.
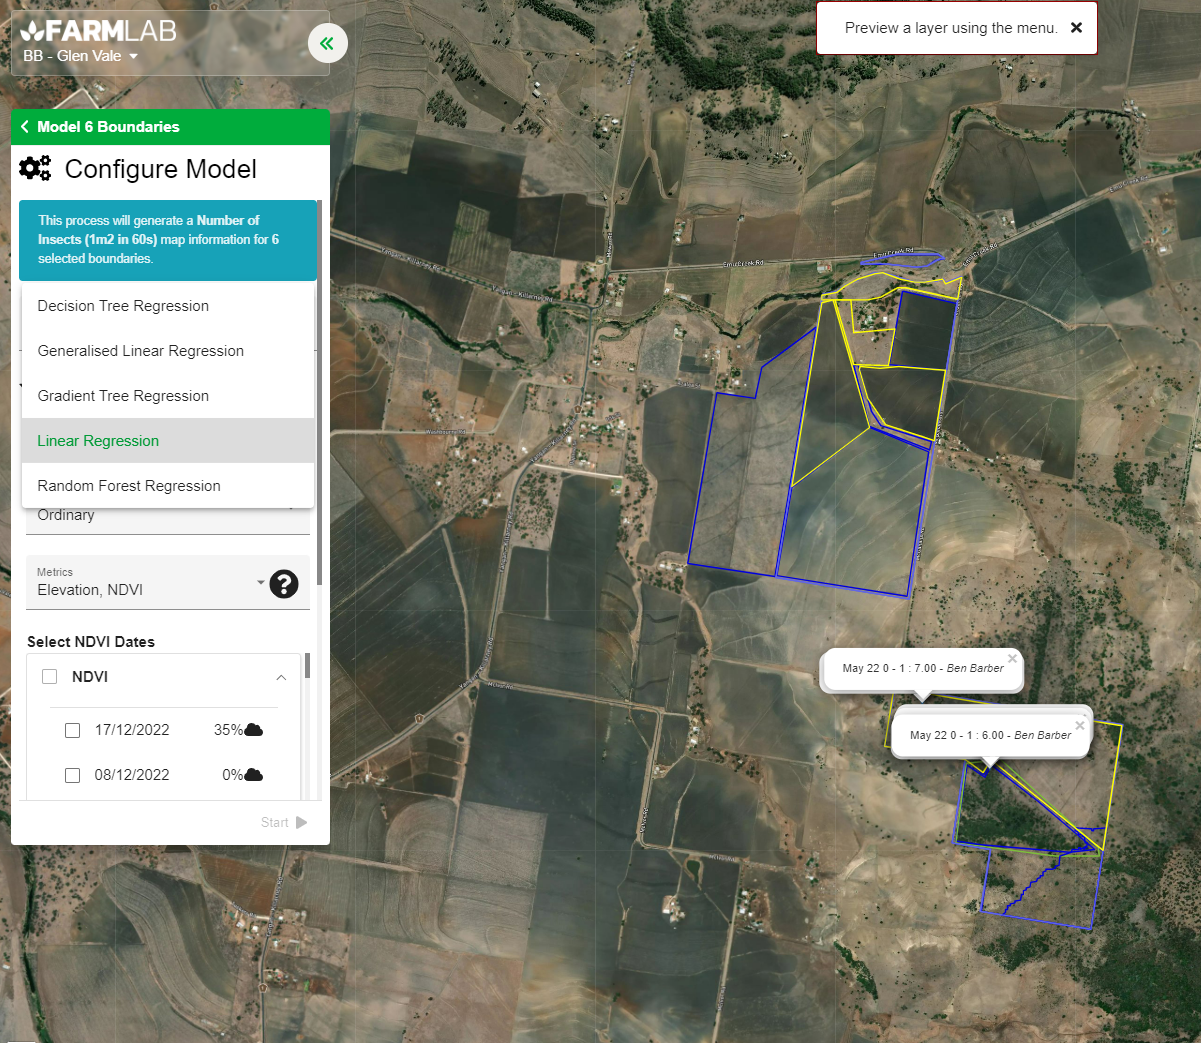
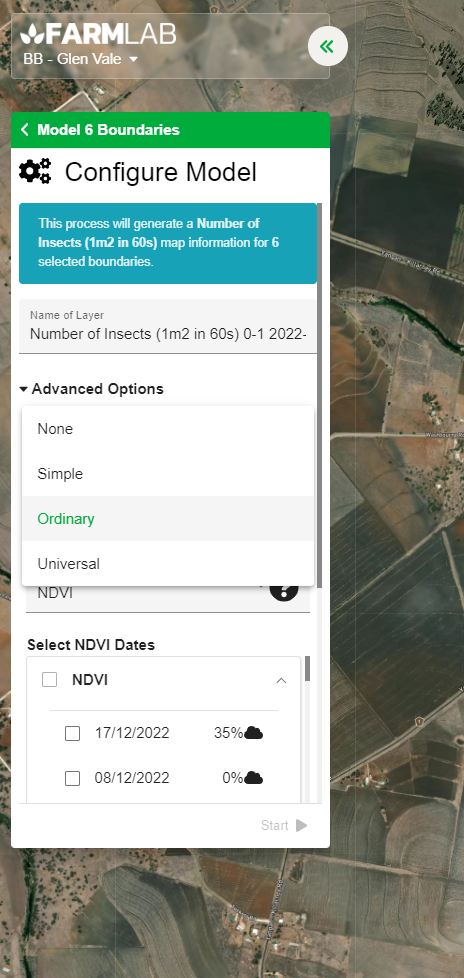
5. Choose the type of krigging you want to use (none, ordinary, simple, or universal). For beginners, we recommend using ordinary. This will improve the accuracy of your model by using the soil test results to krig the results back into your model. If you skip this step, your model will depend solely on the layers you use to model (as described in the next step).
6. Select the layers you want to use. You can also use previous models to create new ones. The layers you choose will serve as the covariates for your model and are crucial for setting up a good model. You can also import your own layers, such as yield maps and EM38 surveys, for added accuracy.
As a starting point, when modeling nutrients, consider using:
- NDVI and TWI at the paddock scale for pasture systems
- NDVI and elevation at the farm scale for pasture systems
- NDVI for peak biomass months for cropping systems
When modeling soil properties (clay/sand/silt and carbon), consider using:
- Bulk density, elevation, or TWI at the farm scale.
- NDVI and TWI at the paddock scale.
Keep in mind that FarmLab does not recommend a specific way to model your results. Climate, region, and farming system will greatly impact the inputs you choose. It is best to run multiple models and compare them to determine the best option.
7. Click "Start" to initiate your model.
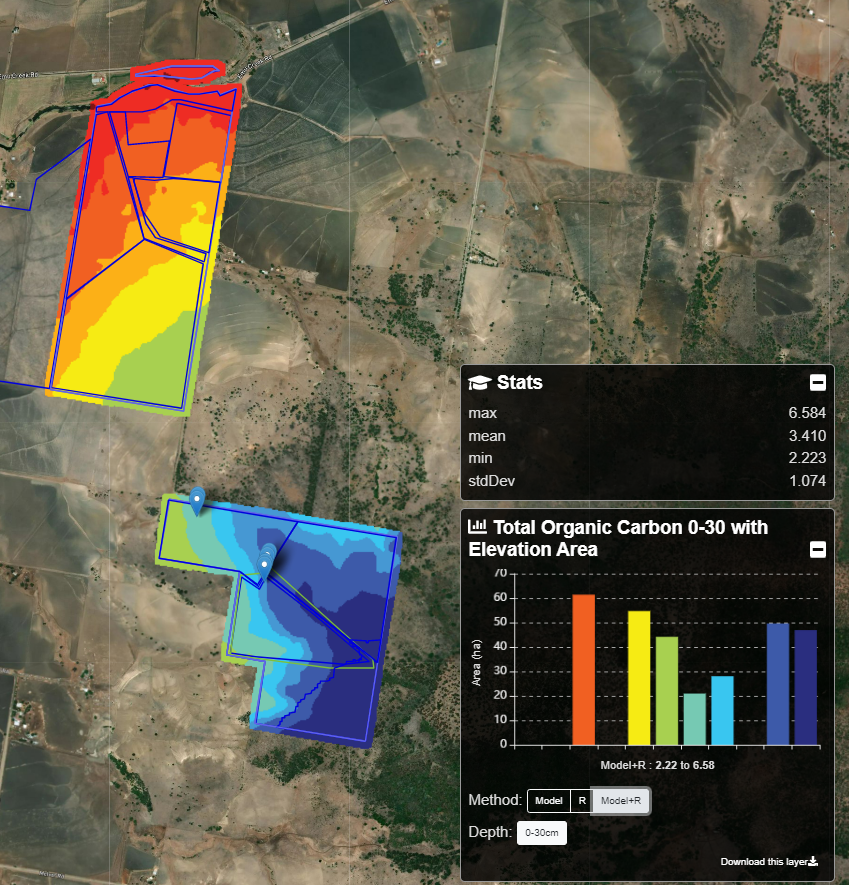
8. Once the model is complete, you will see the statistics associated with it. Pay attention to:
- The P and T values for each input (only terrain (or elevation) was used below).
- The R Squared of the model you created
- The RMSE
- The number of training samples used to generate the model.

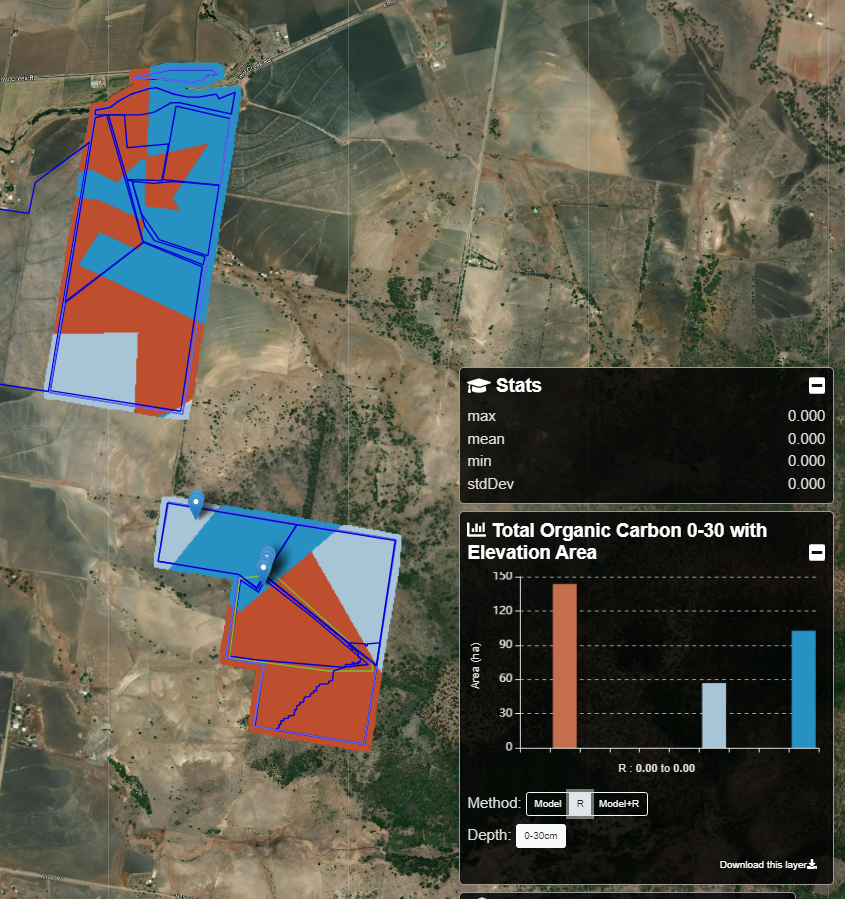
9. Using the selector in the bottom right corner, you can view the 'R' (Residual) map, which shows the difference between the soil samples and the predicted model (blue indicates under-prediction, red indicates over-prediction). The 'Model+R' shows the krigged residual model, which is often the final product. This is a combination of the model and the residuals, ensuring that the actual sample data you used is included in the model.
For more information, check out our webinar on soil carbon modeling below: