The creation of uncalibrated soil management zones can help you identify areas with common soil properties or nutrients. There are two specific cases that have been designed in particular, you are:
- Farm scale soil management, primarily for the management and measurement of soil properties and soil carbon, and
- Paddock scale soil management, primarily for nutrient management.
Each of the use cases requires separate datasets, depending on what is being analysed. Further information on each use case and the datasets required can be found below.
Importantly, any soil management zones created using these tools are initially ‘uncalibrated’ until you determine their accuracy through ‘ground-truthing’. This could be either through soil sampling each zone, or visually inspecting the soil management zones (or a combination of the two). The intent is to allow you to determine whether or not the zones you’ve created are accurate, and if necessary to change the inputs, or the ratio of inputs, or both, until you are satisfied that the zones represent the soil characteristics or nutrients being managed. Once you are satisfied, the zones are ‘calibrated’ and can be used to assist with soil management over an area.
Farm-scale Soil Management Zones
We have designed ‘Farm Scale Zones’ to help you conduct an initial soil analysis across various paddocks that have had different management practices or crop types grown. It can be used to help map soil properties that or slow moving through time such as soil organic carbon across paddocks, as the inputs used generally aren’t impacted in the short term by changes to inputs or crop type.
Recommended inputs
- Topographical Wetness Index (TWI), and
- Elevation
Paddock-scale Soil Management Zones
We have created ‘Paddock Scale’ zones to help you manage within a single paddock. The resulting zones created can be used to help show high performing or poor performing areas of a single paddock, and once calibrated, can be used to apply inputs precisely over an area. Importantly zones created using this process should not be used to compare to other paddocks, as any data used in the algorithm is normalised across each individual paddock.
Recommended Inputs
- Normalised NDVI (stacked over 3-5 years at a peak biomass period, depending on availability)
- Topographical Wetness Index (TWI), and
- Elevation
Determining the Number of Zones and Input Ratios
By allowing you to adjust the number of zones and the weighting of each input, the tool provides flexibility in helping develop accurate soil management zones. To help determine the ‘correct’ number of soil management zones and weighting of inputs, a histogram of each of the inputs has been provided following the creation of the zones (figure 1).
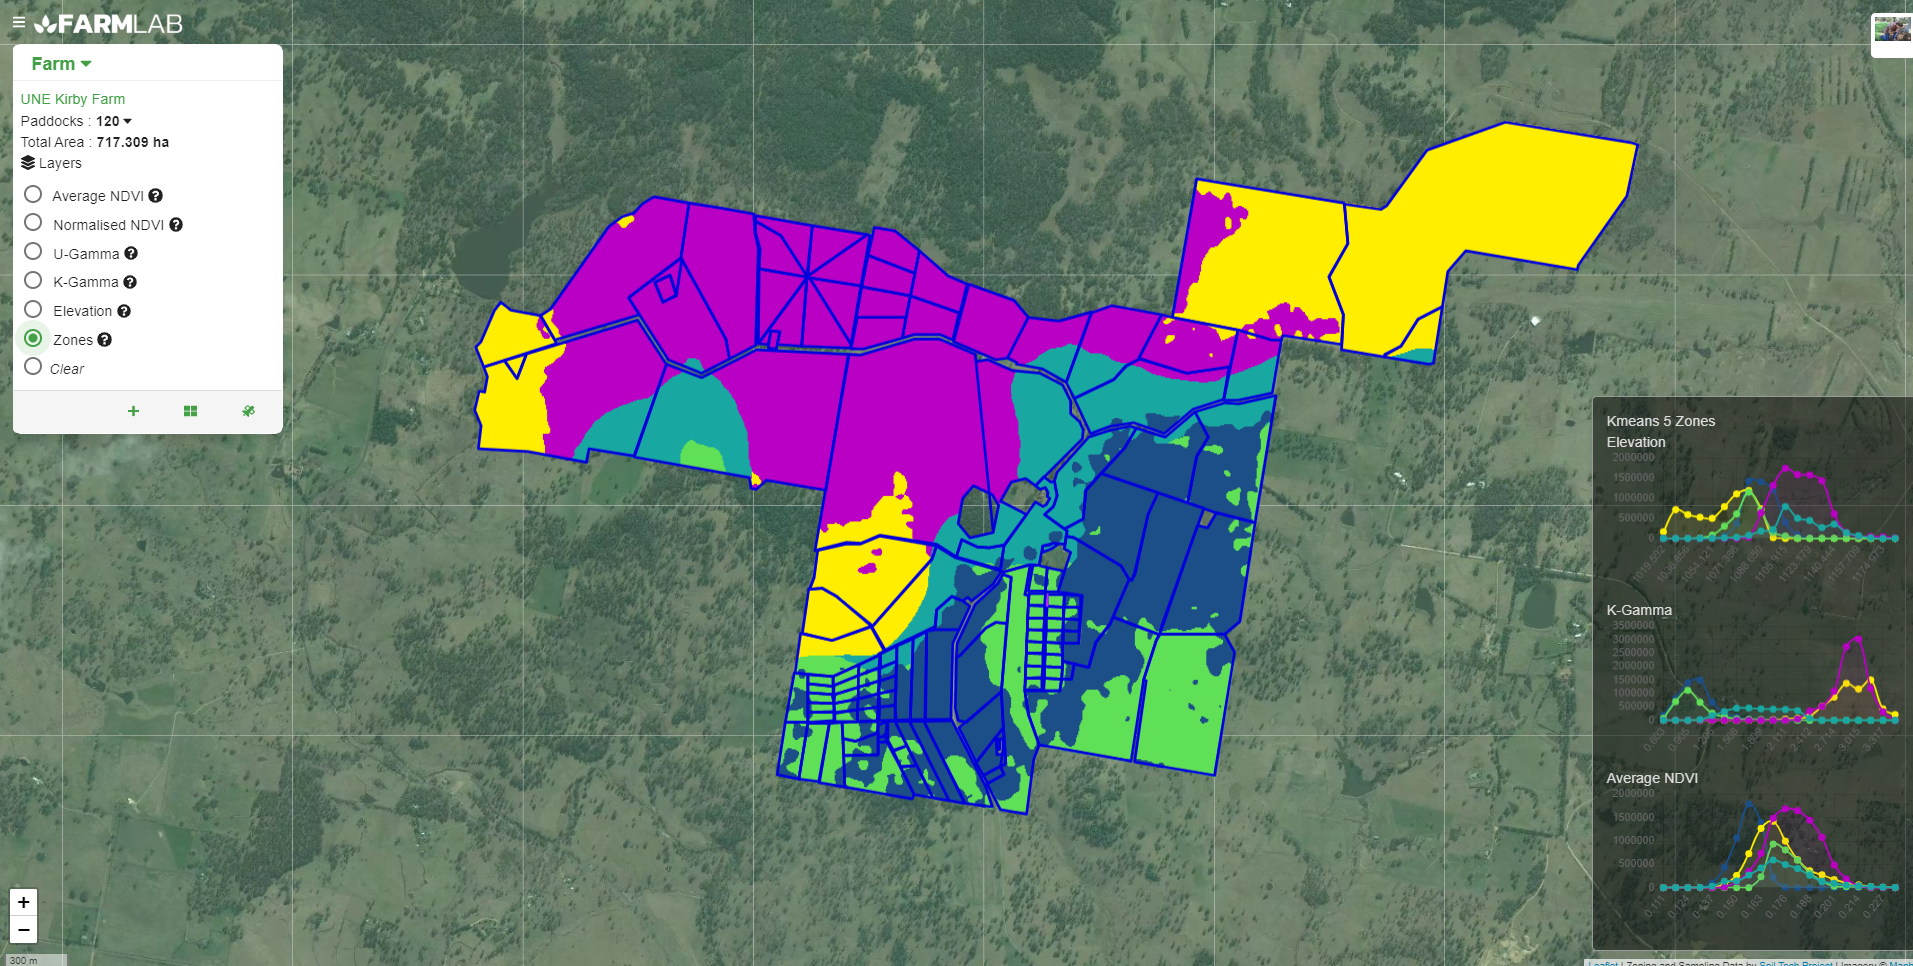
Figure 1. The histogram at the bottom right hand side helps you determine the correct number of zones and the ratio of parameters used.
Each zone is represented on the histogram, with each coloured line in the histogram representing that zone on the map. There are 2 key things to note when interpreting the histogram:
1. Each zone should represent a distinct peak, without overlap with another zone’s peak. If two or more zones have overlapping peaks, then these zones exhibit the same information and one may be redundant. For example, when looking at the elevation histogram in figure 1, the peak of the yellow zone overlaps the peak of the green zone, and so shows that these two zones are probably similar (at least in terms of elevation).
2. If two or more variables have been used, and one shows significant overlap in peaks, this can be changed by increasing the weighting of the variable with the overlapping peaks.
When using multiple variables to create management zones, such as gamma radiometrics [TB1] and elevation, some overlap in peaks may be unavoidable. For example, in figure 1 above, the green and yellow zones overlaps in the elevation histogram, but are separate in the K-Gamma histogram. This zone is therefore reflective of a difference in K-Gamma, rather than elevation.